| 1 |
# bqplot |
| 2 |
|
| 3 |
[](https://travis-ci.com/bqplot/bqplot) |
| 4 |
[](http://bqplot.readthedocs.org) |
| 5 |
[](https://mybinder.org/v2/gh/bqplot/bqplot/stable?filepath=examples/Index.ipynb) |
| 6 |
[](https://gitter.im/jupyter-widgets/Lobby) |
| 7 |
|
| 8 |
2-D plotting library for Project Jupyter |
| 9 |
|
| 10 |
## Introduction |
| 11 |
|
| 12 |
`bqplot` is a 2-D visualization system for Jupyter, based on the constructs of |
| 13 |
the *Grammar of Graphics*. |
| 14 |
|
| 15 |
## Usage |
| 16 |
|
| 17 |
[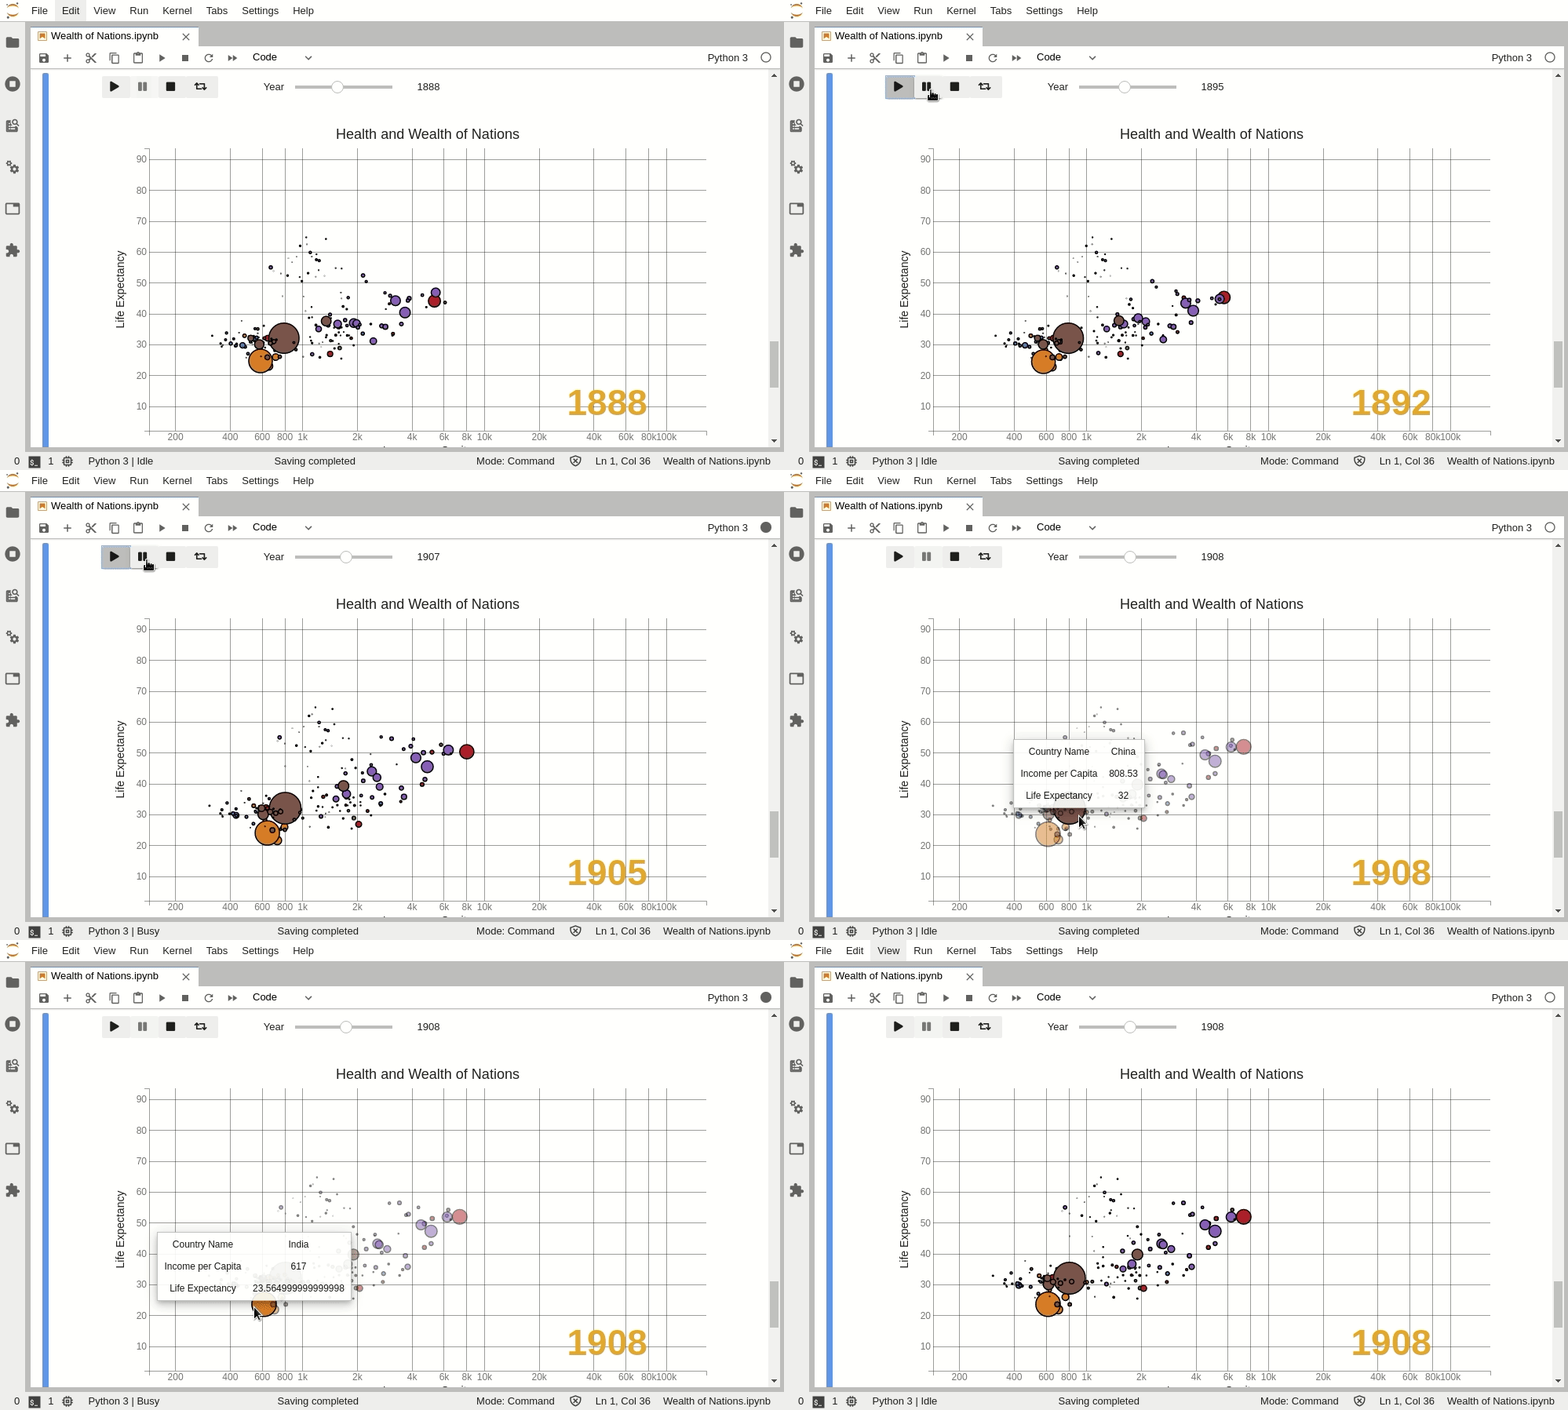](https://github.com/bqplot/bqplot/blob/master/examples/Applications/Wealth%20Of%20Nations/Bubble%20Chart.ipynb) |
| 18 |
|
| 19 |
In bqplot, every component of a plot is an interactive widget. This allows the |
| 20 |
user to integrate visualizations with other Jupyter interactive widgets to |
| 21 |
create integrated GUIs with a few lines of Python code. |
| 22 |
|
| 23 |
## Goals |
| 24 |
|
| 25 |
- Provide a unified framework for 2-D visualizations with a pythonic API |
| 26 |
- Provide a sensible API for adding user interactions (panning, zooming, selection, etc) |
| 27 |
|
| 28 |
Two APIs are provided |
| 29 |
|
| 30 |
- `Object Model`, which |
| 31 |
is inspired by the constructs of the Grammar of Graphics (figure, marks, axes, |
| 32 |
scales). This API is verbose but is fully customizable |
| 33 |
- `pyplot`, which is a context-based API similar to Matplotlib's pyplot. `pyplot` provides sensible default choices for most parameters |
| 34 |
|
| 35 |
## Trying it online |
| 36 |
|
| 37 |
To try out bqplot interactively in your web browser, just click on the binder |
| 38 |
link: |
| 39 |
|
| 40 |
[](https://mybinder.org/v2/gh/bqplot/bqplot/stable?filepath=examples/Index.ipynb) |
| 41 |
|
| 42 |
### Dependencies |
| 43 |
|
| 44 |
This package depends on the following packages: |
| 45 |
|
| 46 |
- `ipywidgets` (version >=7.0.0, <8.0) |
| 47 |
- `traitlets` (version >=4.3.0, <5.0) |
| 48 |
- `traittypes` (Version >=0.2.1, <0.3) |
| 49 |
- `numpy` |
| 50 |
- `pandas` |
| 51 |
|
| 52 |
### Installation |
| 53 |
|
| 54 |
Using pip: |
| 55 |
|
| 56 |
``` |
| 57 |
$ pip install bqplot |
| 58 |
``` |
| 59 |
|
| 60 |
Using conda |
| 61 |
|
| 62 |
``` |
| 63 |
$ conda install -c conda-forge bqplot |
| 64 |
``` |
| 65 |
|
| 66 |
If you are using JupyterLab <=2: |
| 67 |
|
| 68 |
``` |
| 69 |
$ jupyter labextension install @jupyter-widgets/jupyterlab-manager bqplot |
| 70 |
``` |
| 71 |
|
| 72 |
##### Development installation |
| 73 |
|
| 74 |
For a development installation (requires JupyterLab (version >= 3) and yarn): |
| 75 |
|
| 76 |
``` |
| 77 |
$ git clone https://github.com/bqplot/bqplot.git |
| 78 |
$ cd bqplot |
| 79 |
$ pip install -e . |
| 80 |
$ jupyter nbextension install --py --overwrite --symlink --sys-prefix bqplot |
| 81 |
$ jupyter nbextension enable --py --sys-prefix bqplot |
| 82 |
``` |
| 83 |
|
| 84 |
Note for developers: the `--symlink` argument on Linux or OS X allows one to |
| 85 |
modify the JavaScript code in-place. This feature is not available |
| 86 |
with Windows. |
| 87 |
|
| 88 |
For the experimental JupyterLab extension, install the Python package, make sure the Jupyter widgets extension is installed, and install the bqplot extension: |
| 89 |
|
| 90 |
``` |
| 91 |
$ pip install "ipywidgets>=7.6" |
| 92 |
$ jupyter labextension develop . --overwrite |
| 93 |
``` |
| 94 |
|
| 95 |
Whenever you make a change of the JavaScript code, you will need to rebuild: |
| 96 |
|
| 97 |
``` |
| 98 |
cd js |
| 99 |
yarn run build |
| 100 |
``` |
| 101 |
|
| 102 |
Then refreshing the JupyterLab/Jupyter Notebook is enough to reload the changes. |
| 103 |
|
| 104 |
##### Running tests |
| 105 |
|
| 106 |
You can install the dependencies necessary to run the tests with: |
| 107 |
|
| 108 |
```bash |
| 109 |
conda env update -f test-environment.yml |
| 110 |
``` |
| 111 |
|
| 112 |
And run it with for Python tests: |
| 113 |
|
| 114 |
```bash |
| 115 |
pytest |
| 116 |
``` |
| 117 |
|
| 118 |
And `cd js` to run the JS tests with: |
| 119 |
|
| 120 |
```bash |
| 121 |
yarn run test |
| 122 |
``` |
| 123 |
|
| 124 |
Every time you make a change on your tests it's necessary to rebuild the JS side: |
| 125 |
|
| 126 |
```bash |
| 127 |
yarn run build |
| 128 |
``` |
| 129 |
|
| 130 |
## Examples |
| 131 |
|
| 132 |
### Using the `pyplot` API |
| 133 |
|
| 134 |
[](https://github.com/bqplot/bqplot/blob/master/examples/Basic%20Plotting/Pyplot.ipynb) |
| 135 |
|
| 136 |
### Using the `Object Model` API |
| 137 |
|
| 138 |
[](https://github.com/bqplot/bqplot/blob/master/examples/Advanced%20Plotting/Advanced%20Plotting.ipynb) |
| 139 |
|
| 140 |
## Documentation |
| 141 |
|
| 142 |
Full documentation is available at https://bqplot.readthedocs.io/ |
| 143 |
|
| 144 |
## Install a previous bqplot version (Only for JupyterLab <= 2) |
| 145 |
|
| 146 |
In order to install a previous bqplot version, you need to know which front-end version (JavaScript) matches with the back-end version (Python). |
| 147 |
|
| 148 |
For example, in order to install bqplot `0.11.9`, you need the labextension version `0.4.9`. |
| 149 |
|
| 150 |
``` |
| 151 |
$ pip install bqplot==0.11.9 |
| 152 |
$ jupyter labextension install [email protected] |
| 153 |
``` |
| 154 |
|
| 155 |
Versions lookup table: |
| 156 |
|
| 157 |
| `back-end (Python)` | `front-end (JavaScript)` | |
| 158 |
|---------------------|--------------------------| |
| 159 |
| 0.12.14 | 0.5.14 | |
| 160 |
| 0.12.13 | 0.5.13 | |
| 161 |
| 0.12.12 | 0.5.12 | |
| 162 |
| 0.12.11 | 0.5.11 | |
| 163 |
| 0.12.10 | 0.5.10 | |
| 164 |
| 0.12.9 | 0.5.9 | |
| 165 |
| 0.12.8 | 0.5.8 | |
| 166 |
| 0.12.7 | 0.5.7 | |
| 167 |
| 0.12.6 | 0.5.6 | |
| 168 |
| 0.12.4 | 0.5.4 | |
| 169 |
| 0.12.3 | 0.5.3 | |
| 170 |
| 0.12.2 | 0.5.2 | |
| 171 |
| 0.12.1 | 0.5.1 | |
| 172 |
| 0.12.0 | 0.5.0 | |
| 173 |
| 0.11.9 | 0.4.9 | |
| 174 |
| 0.11.8 | 0.4.8 | |
| 175 |
| 0.11.7 | 0.4.7 | |
| 176 |
| 0.11.6 | 0.4.6 | |
| 177 |
| 0.11.5 | 0.4.5 | |
| 178 |
| 0.11.4 | 0.4.5 | |
| 179 |
| 0.11.3 | 0.4.4 | |
| 180 |
| 0.11.2 | 0.4.3 | |
| 181 |
| 0.11.1 | 0.4.1 | |
| 182 |
| 0.11.0 | 0.4.0 | |
| 183 |
|
| 184 |
## Development |
| 185 |
|
| 186 |
See our [contributing guidelines](CONTRIBUTING.md) to know how to contribute and set up a development environment. |
| 187 |
|
| 188 |
## License |
| 189 |
|
| 190 |
This software is licensed under the Apache 2.0 license. See the [LICENSE](LICENSE) file |
| 191 |
for details. |